
27 day magnetic activity forecast
View the Magnetic Activity Review
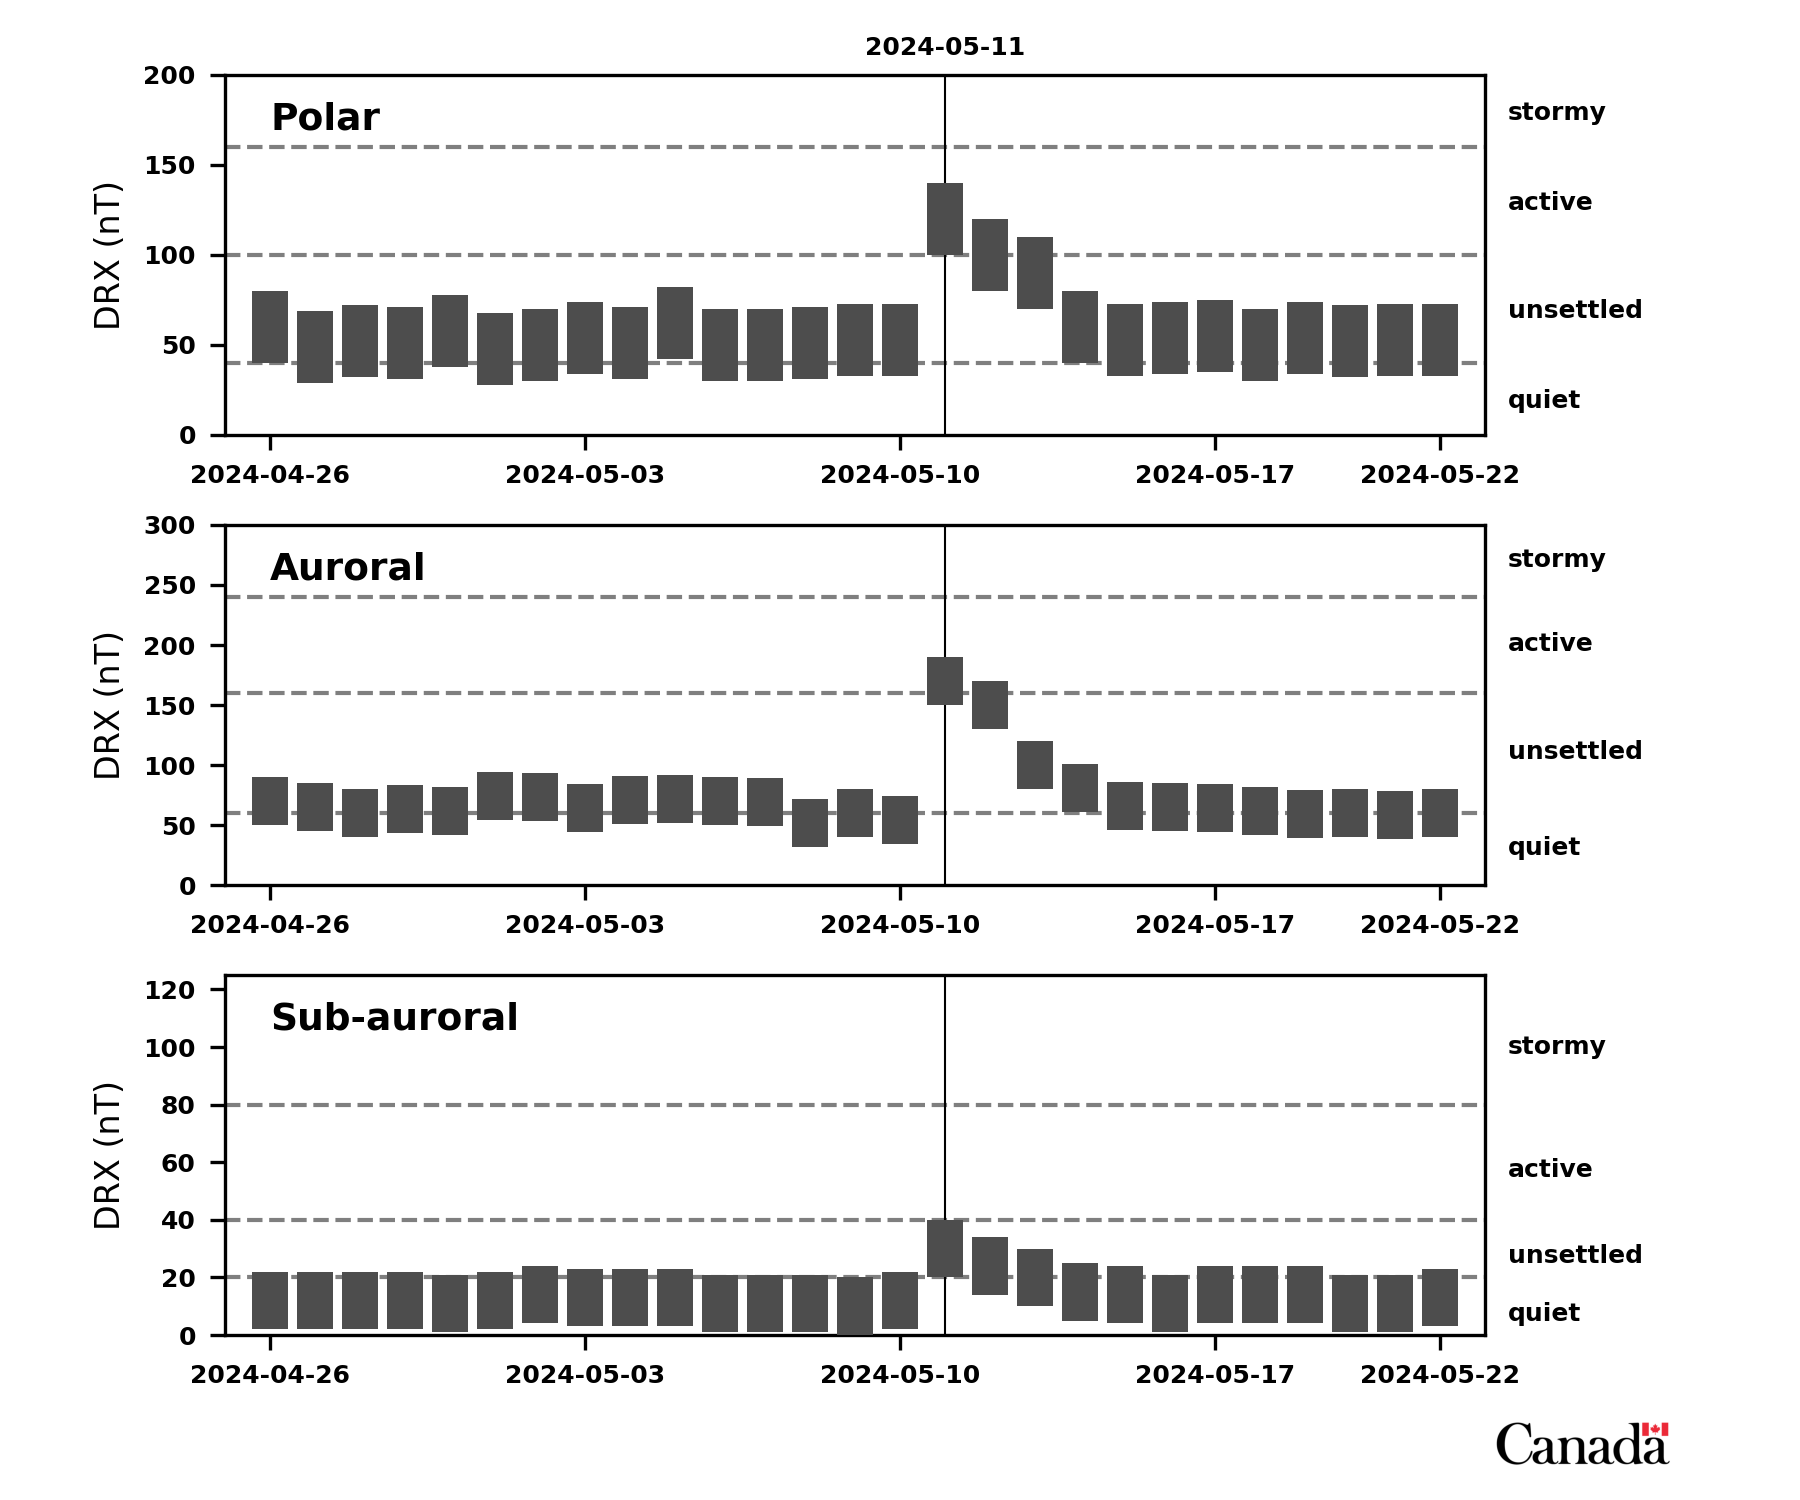
The parameter used for forecasting the magnetic activity in the 27 day forecast is the daily index DRX. DRX is the average of the hourly ranges (maximum minus minimum during each hour) in the X (northward) component of the magnetic field for each UT day. DRX values are provided for the polar cap, auroral zone, and the sub-auroral zone. The units are nanoteslas (nT).
27 Day Magnetic Activity Forecast (Graphic)
27 Day Magnetic Activity Forecast (Text)
| Date | Zones | ||
|---|---|---|---|
| Polar | Auroral | Sub-Auroral | |
| 2026-05-01 | 68 | 93 | 14 |
| 2026-05-02 | 68 | 91 | 14 |
| 2026-05-03 | 64 | 91 | 14 |
| 2026-05-04 | 66 | 85 | 14 |
| 2026-05-05 | 72 | 86 | 14 |
| 2026-05-06 | 79 | 79 | 15 |
| 2026-05-07 | 81 | 76 | 15 |
| 2026-05-08 | 82 | 75 | 15 |
| 2026-05-09 | 83 | 81 | 15 |
| 2026-05-10 | 67 | 78 | 14 |
| 2026-05-11 | 63 | 76 | 14 |
| 2026-05-12 | 66 | 77 | 14 |
| 2026-05-13 | 77 | 82 | 14 |
| 2026-05-14 | 70 | 81 | 13 |
| 2026-05-15 | 67 | 79 | 13 |
| 2026-05-16 | 60 | 80 | 13 |
| 2026-05-17 | 61 | 78 | 14 |
| 2026-05-18 | 60 | 75 | 14 |
| 2026-05-19 | 61 | 80 | 13 |
| 2026-05-20 | 65 | 79 | 14 |
| 2026-05-21 | 66 | 79 | 14 |
| 2026-05-22 | 69 | 86 | 13 |
| 2026-05-23 | 62 | 85 | 13 |
| 2026-05-24 | 68 | 79 | 14 |
| 2026-05-25 | 67 | 88 | 13 |
| 2026-05-26 | 58 | 77 | 13 |
| 2026-05-27 | 65 | 72 | 13 |